
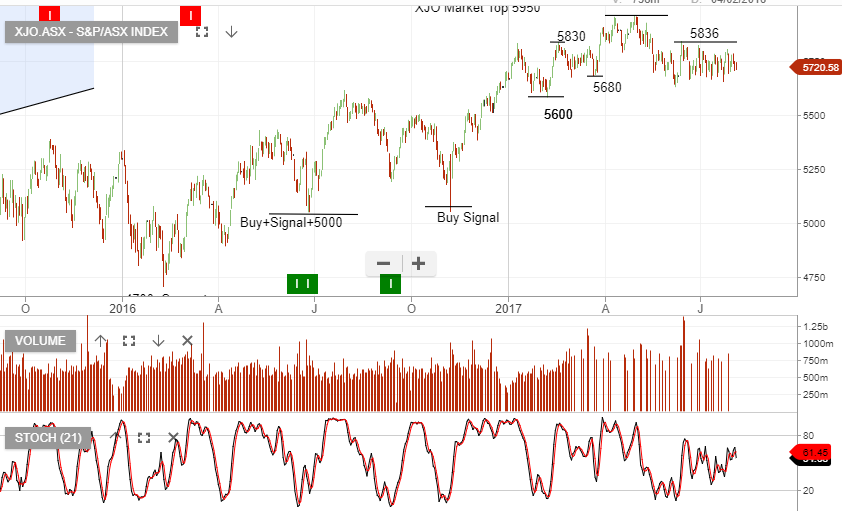
The S&P/ASX 200 Index finished the week up 0.31%
The best performer was the Utilities sector, up 3.6% and the worst performer was the Financials ex-Property sector, down 1.1%.
The XJO remains in a “lower high” pattern, as illustrated on the chart below.
