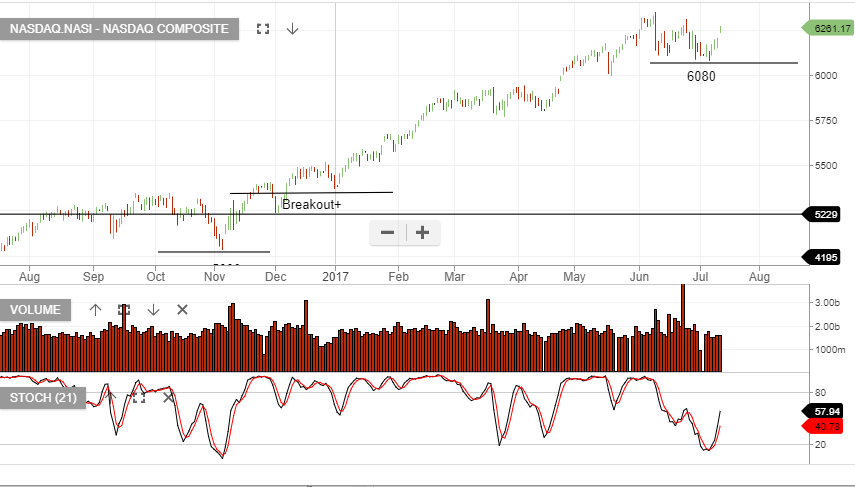
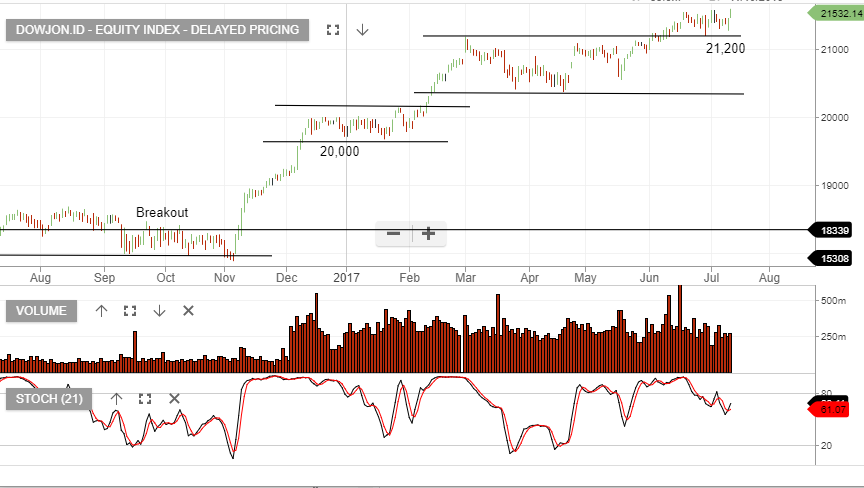
The Dow Jones and NASDAQ charts below show the indices continuing with the “higher high and higher low” formation.
The XJO shows a slightly more bearish pattern, as our local market struggles below the recent 5850 high.



The Dow Jones and NASDAQ charts below show the indices continuing with the “higher high and higher low” formation.
The XJO shows a slightly more bearish pattern, as our local market struggles below the recent 5850 high.
Join Investor Signals today and start your journey to better, more disciplined returns.