
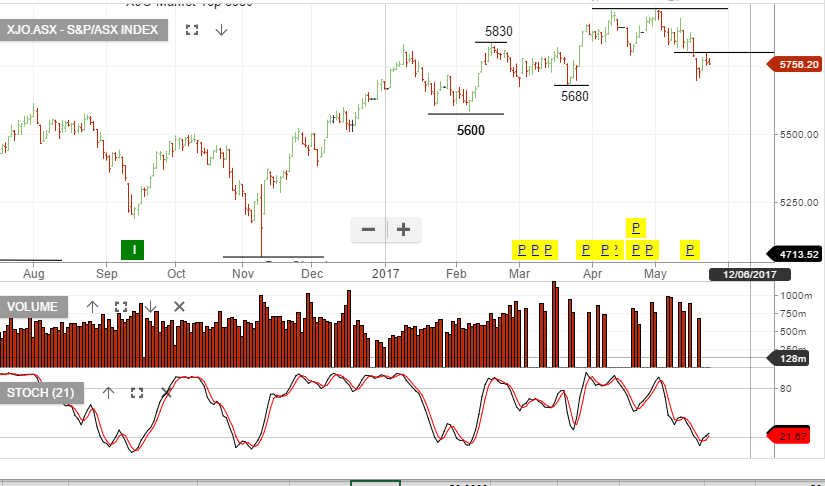
As an update to our recent Chart Watch on the XJO, we highlight again the lower high structure that has now formed. We were expecting a bounce into the 5790 – 5850 level before further selling pressure. Yesterday the price action hit resistance at 5796 and today’s open looks weak against a positive lead from the US.
.