The XJO made a low on the 19th of April at 5790 and has since rallied to within 40 points of the trend high that began in Feb 2016.
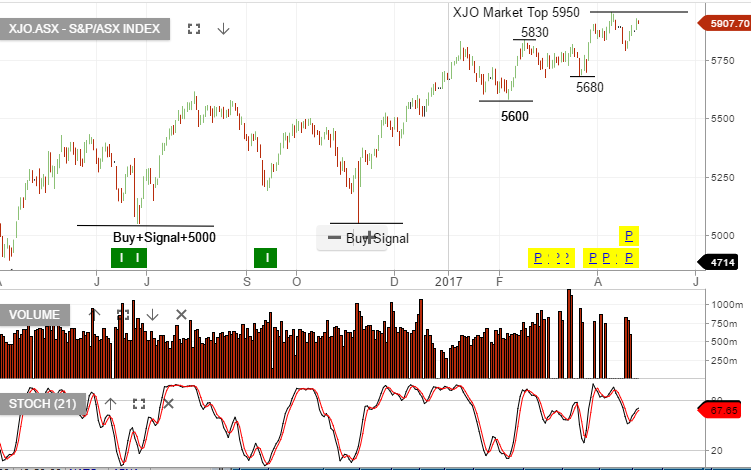

The XJO made a low on the 19th of April at 5790 and has since rallied to within 40 points of the trend high that began in Feb 2016.
Join Investor Signals today and start your journey to better, more disciplined returns.