
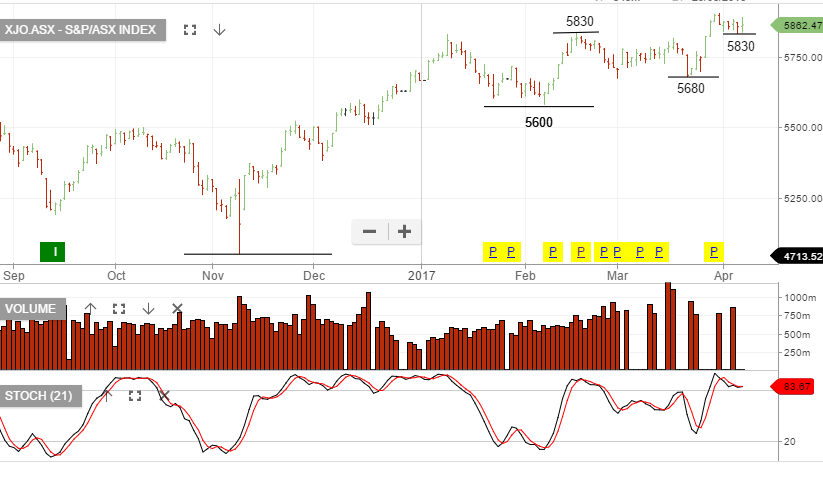
The XJO continues to make higher low formations with 5830 providing buying support throughout the past week. If we see price action break below 5830 and then form resistance, we’ll view this as the beginning of structural weakness for the local market.
