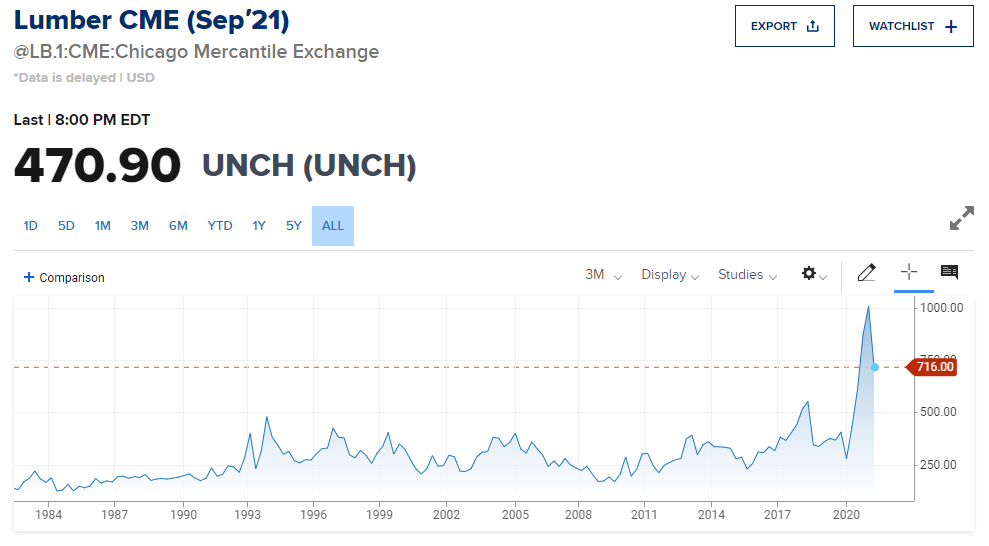
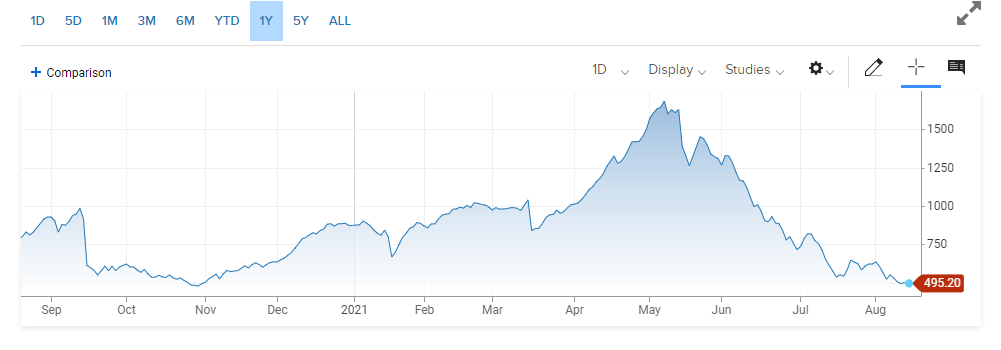
The first Lumber graph below shows the long-term trend back to 1984 and the second graph shows the 12-month price action.

The first Lumber graph below shows the long-term trend back to 1984 and the second graph shows the 12-month price action.
Join Investor Signals today and start your journey to better, more disciplined returns.