
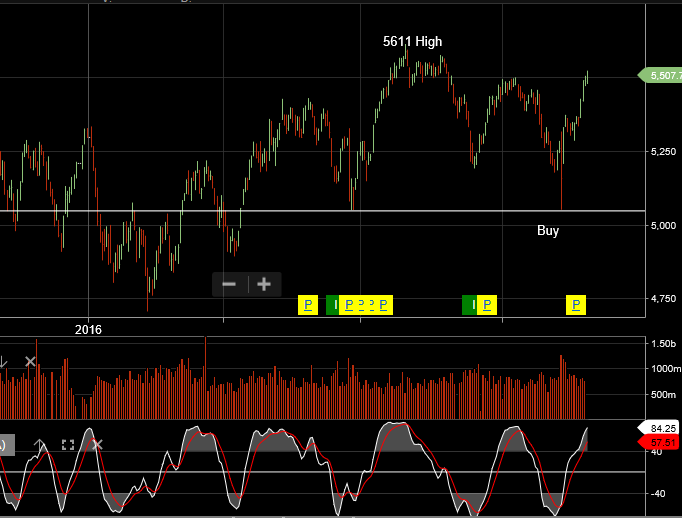
Our algo engine is flagging the lower high technical structure in the ASX 200 index (XJO) and a number of the stocks making up the index are also displaying a similar set up. The resources are the driving force behind the index rally and any attempt to short the market or the index needs to be built upon a view that the big cap resources have exhausted their current rally.
Whilst we’re watching the above and looking for further confirmation, we’re not quite there with regards to changing our existing “long market bias”.
The following chart of the XJO shows the index approaching the previous high of 5611 points (set on 1/8/16). The momentum indicators still remain positive at this stage.
