
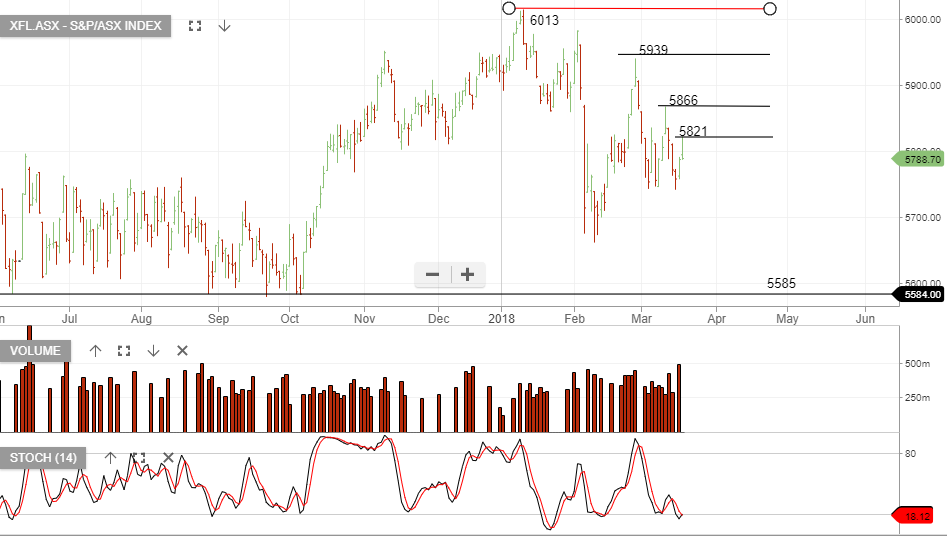
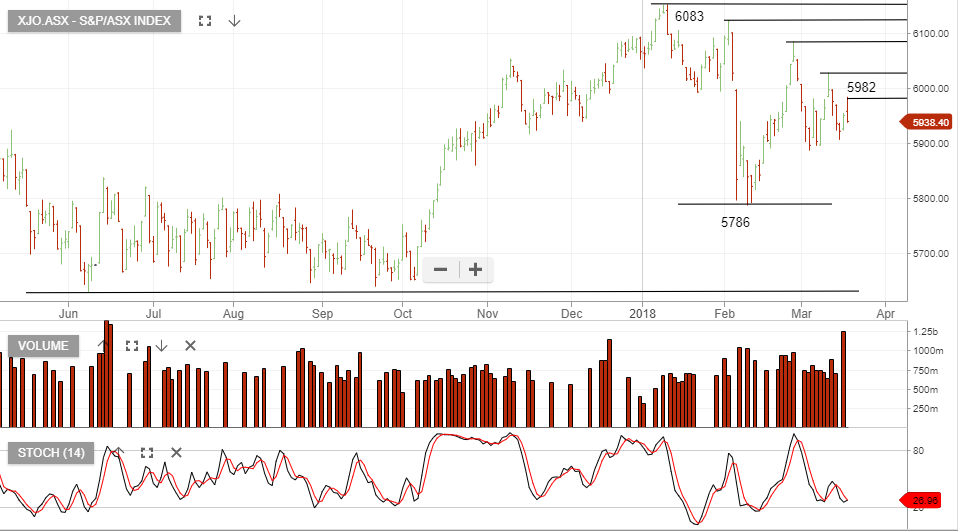
The XJO chart displays the recent pattern of negative price reversals.
The latest reversal in today’s trading session, created a “lower high” at 5982.
Technical traders will be leaning on the short-side of the market, until the index trades back through the 5982 resistance.
XJO Index