The XJO chart below shows the index breaking-down after finding selling pressure at the recent lower high formation on the 2nd of June.
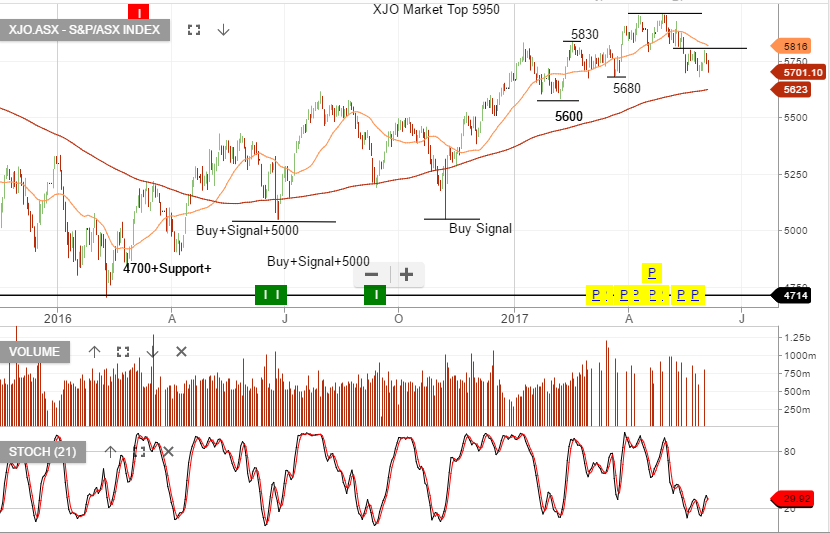

The XJO chart below shows the index breaking-down after finding selling pressure at the recent lower high formation on the 2nd of June.
Join Investor Signals today and start your journey to better, more disciplined returns.